SAP BusinessObjects Enterprise InfoView User's Guide
Guided analysis
Guided analysis provides you with suggested
navigation paths—or storylines—through objects in
InfoView. When you view an
object, a storyline suggests other objects that you may want to view and, if
possible, displays a list of the objects in the storyline that lead to the
current object that you are viewing. This enables you to show connections
between reports.
Consider a company in a volatile industry. Several
factors affect its profit margin. One business analyst is assigned to track
each factor. At the end of a quarter, each analyst creates a report to
summarize the affect of their factor. When the analysts put their reports into
storylines, it allows the management team to track each factor's effect during
the quarter.
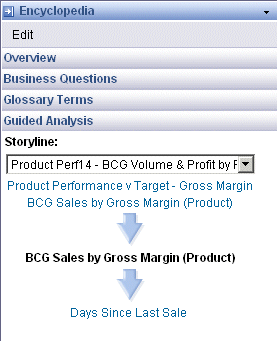
The following is an example of a storyline in the
Guided
Analysis tab:

In this section:
|
SAP BusinessObjects http://www.sap.com/sapbusinessobjects/ Support services http://service.sap.com/bosap-support/ Product Documentation on the Web http://help.sap.com/ |