SAP BusinessObjects Enterprise InfoView User's Guide
Overview of exception highlighting
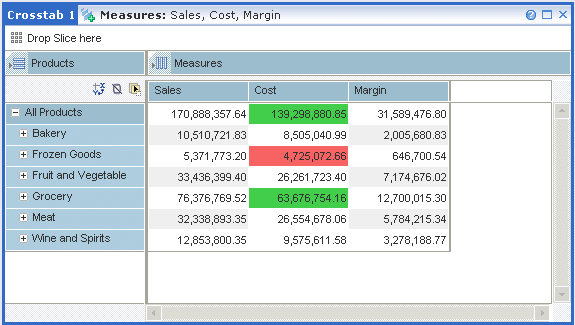
You can apply color to the cells in a crosstab to
highlight important differences or unexpected results. For example, you might
want to highlight a value that is greater or less than a particular value.

Exception highlighting can be performed globally
on the entire crosstab, or on individual columns or rows. Exception
highlighting settings are saved with the workspace.
Note: On an axis that has nested dimensions, you
can add row or column highlighting only to members of the innermost dimension.
In this section:
|
SAP BusinessObjects http://www.sap.com/sapbusinessobjects/ Support services http://service.sap.com/bosap-support/ Product Documentation on the Web http://help.sap.com/ |