SAP BusinessObjects Enterprise InfoView User's Guide
Visual totals
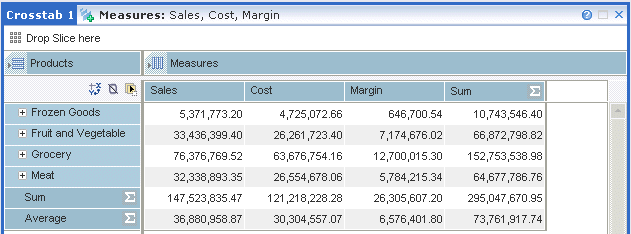
Visual totals are dynamic aggregations of your
data, such as sums or averages, displayed in rows or columns added to the
crosstab. Visual totals aggregate the data in the crosstab without regard to
members' relationships in the hierarchy. For example, if your crosstab displays
the members Drink and
Food, and
also the child members
Bread and
Meat, the
visual total aggregates the data for all four members despite
Bread and
Meat being
child members of
Food.
Visual totals appear at the bottom or at the right
side of the crosstab but are not created as members like other calculations
are. (For example, visual totals do not appear in the Member Selector.) They
can be added and removed individually, or all turned on and off simultaneously.

A typical visual total calculation would be the
sum of all values in a row or column, although you can apply other summary
calculations as well:
Name
| Description
|
|---|---|
Sum
| Sums a range
of cell values.
|
Average
| Averages a
range of cell values.
|
Count
| Counts the
number of non-null cells in a range.
|
Min
| Returns the
minimum value in a range of cell values.
|
Max
| Returns the
maximum value in a range of cell values.
|
Median
| Returns the
median value for a range of cell values. The median is the middle value in a
set.
|
Variance
| Returns the
variance for a range of cell values. Variance is the average squared deviation
of each number from its mean.
|
Standard
Deviation
| Returns the
standard deviation for a range of cell values using the biased population
formula. Standard deviation is the square root of the variance.
|
Aggregate
| The Aggregate
total is available only for Microsoft Analysis Services data sources. The
aggregate operation applies the aggregation operation specified on the server
to the range of cell values.
|
These calculations are dynamic; the result set is
always based on the members that have been selected in the query. For example,
if you add a Sum calculation row, the calculation sums the values from all row
members. If you then remove a row member, the calculation adjusts automatically
for the removed member, summing only the values from visible row members.
For more information about
the different visual total calculations, see
“Custom calculations” in the
BusinessObjects Voyager User's Guide.
Note:
- Visual totals ignore cells that are the result of other calculations.
- Visual totals do not take into account parent-child relationships when calculating cell values in a range. For example, if both a parent member and its child member are specified on an axis, and the visual total added is a Sum, the child member is added to the Sum twice: once as a single member and again as a contribution to the total of its parent member.
In this section:
|
SAP BusinessObjects http://www.sap.com/sapbusinessobjects/ Support services http://service.sap.com/bosap-support/ Product Documentation on the Web http://help.sap.com/ |